

This is a pretty simple concept that can bring tremendous value and insight to you, the creator of a Power App. Modern development practices encourage gathering insights from your users’ interactions within your application. With these insights, you can decide how to mature and grow your product. As you see certain features being used, or not, you can make pivotal decisions to enable, expand, build on top of or otherwise improve your app. Shouldn’t we expect the same insights in our Power Apps?
In the wild, these insights are usually provided through an analytics platform like Google, Adobe or a myriad of others. However, unlike basic webpage analytics, like the number of viewers, applications should be gathering additional insights like click events and other interactive information so it can help us further enhance the product for our users. Again, there are solutions available like Adobe Analytics which capture this for a standard web-based application. In Power Apps, though it is a web-based application, we cannot integrate with external providers in the same manner.
In Power Apps, we have a workaround to capture interactions by the users and provide some pretty valuable insights on how our applications are being used.
Background on my Power App
Before we begin, let me explain the app we’re using as the example. I created a Power App to share networking events for consultants in Slalom Boston to attend. We are trying to maximize the value of networking and enabling our consultants to attend events in and around Boston. The app is straight forward:
- View networking opportunities
- Share networking opportunities
- Sign up for a networking opp, and see who else is signed up
- When signing up, it’s added to your Outlook calendar automatically
- During the event, check in to share you’re there and see who else from Slalom is there
- After the event, provide feedback on the event.
Many of the typical info we’d want to know, like sign-ups, check-ins, feedback, is already being tracked since all that data is being saved.
We now want to track the other “stuff” users can do: viewing events, sharing an event with a colleague via email, using filtering, etc.
Capturing Analytics with SharePoint and Power Automate (Flow)
As users interact with your app they are clicking on buttons, pressing on items in galleries, and managing data. Fortunately, due to the asynchronous options in Power Apps, we can add analytics with no impact on the user experience.
First, we need to create the repository to store the analytics. Traditionally, I have used a SharePoint list because they’re really easy to create and set up and easy to grant permission as needed. There is a view threshold limit on the lists but our reporting will actually be done outside of SharePoint. Alternatively, we can use a cloud database or other data store to collect the analytics. Ultimately anything the Power Platform (in this case Power Automate specifically) can connect to we can use.
Here is an example of an analytics list I created in SharePoint:
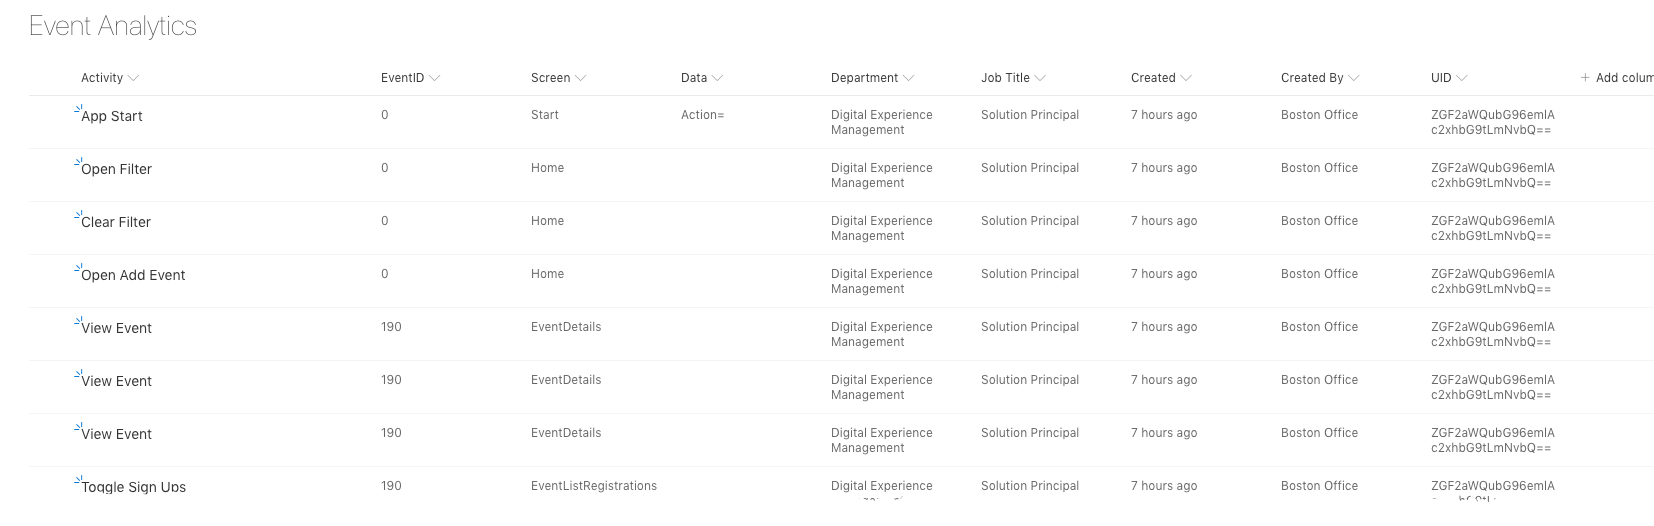
Here’s what we have:
- I renamed Title to Activity, this will store a word or two of what activity we just tracked, like View Event or Share Event.
- EventID will store the row ID of the event, it’s just a number field. I decided against a lookup column to the Events list since there is some unnecessary complexity in getting that data into SharePoint from Power Automate.
- Screen will store what screen the user is on.
- Data is a catch-all for anything else I may need to capture.
- Department and Job Title are about the user doing the clicking. I’m keeping the analytics anonymous (note Created By is generic), but want to capture some basic demographics.
- UID is a hashed version of the user’s email address, so we can track session based activity without actually seeing who it is.
Enter Power Automate
I could have had Power Apps attach directly to my SharePoint list each and every time I want to write into it, but you’ll find that that brings in more work than it’s worth, also, not sure we could keep it anonymous. Using Microsoft Power Automate, you can streamline some of your data processes and what fields are truly necessary, what fields could use default values, along with looking up data in other data sources like someone’s job title, department, etc.
Here are my analytic capturing flows. My first one is the connection with Power Apps, and it gets the current user’s profile info, then it calls my second flow:

Here’s what I did in my first Flow:
- I created an Instant flow, and used Power Apps as the trigger.
- I then grab the user’s Office 365 profile so I can get the demographics.
- Then it calls the second flow through an HTTP action.
- For the UID, I simply converted the email to something incomprehensible to a human:
base64(body('Get_my_profile_(V2)')?['mail']) - Note the variable names i use in the HTTP action, there’s a little cheat I came across to help name these meaningfully, check it out here.
The above calls this second flow, which simply creates the item in SharePoint. I am doing it this way so that the data in SharePoint remains anonymous.
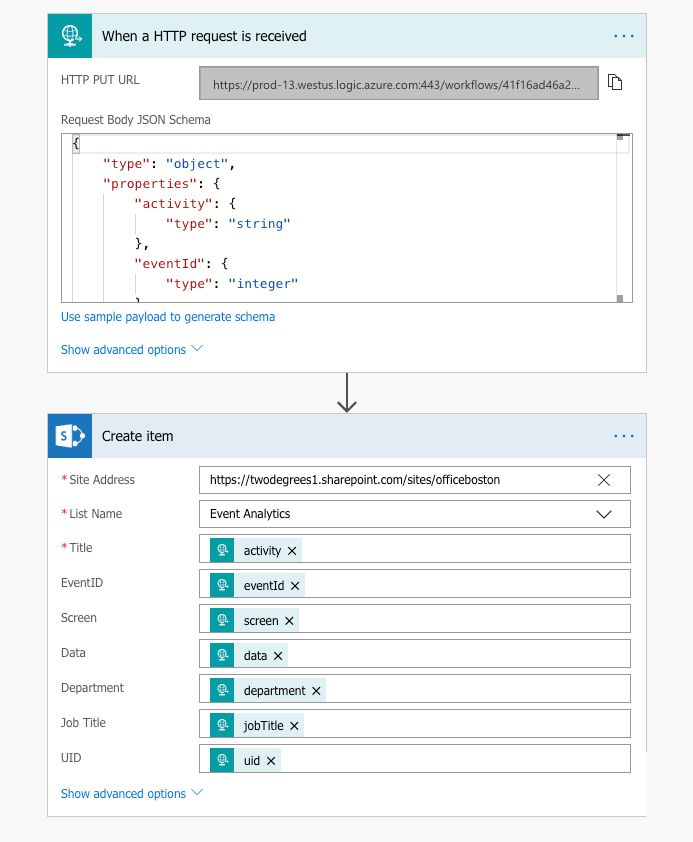
My second flow is even easier:
- I created a flow with the trigger “When a HTTP request is received”.
- Then use a SharePoint Create Item action
BLAM!
SOMETHING TO KEEP IN MIND
This approach is using 2 flows to capture analytics. These flows will run each and every time an event needs to be captured. Your tenant gets 2,000 flow runs per user per month. So for every 1,000 actions, you’re consuming a month’s worth of runs for a user. This isn’t great, depending on the size of your organization and the app. In my case, we have over 6,000 users and about 300 using the app once every few weeks (which having these analytics helped me discover). I’ll be monitoring the counts but we should be okay.
Of course, with Microsoft’s recent announcements around their licensing changes, this may not be an issue. Something to keep in mind / might not be an issue ;)
There may be a few options around this, but more advanced and complex, like creating a custom connector for Power Apps, instead of using Power Automate. Maybe I’ll explore this option later, let me know if you’d be interested.
Capturing Analytics in Power Apps
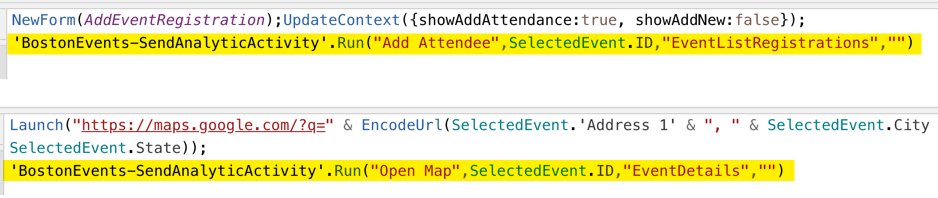
Now throughout my app wherever I want to capture activity analytics I can simply call my flow, and send it a couple parameters, for example:
Once we have this pile of data we now need to report on it and make sense of it all.
Enter PowerBI
Don’t be scared, don’t be intimidated by PowerBI, it’s pretty lightweight. A dashboard can be created in no time and provide some great insights for you. I will not go into great detail here on how to create a dashboard but I will cover the high-level steps. My colleague Andy M. created the dashboard from the data. If you wish me to cover this in greater detail leave a comment below and he will get on it :-)

In the above, we can quickly see:
- App opens, week by week, and by department (practice) yes, it’s dropped some, but our events and activities come in ebbs and flows.
- Conversion rate is a test metric. That’s what great about doing this yourself! Experiment, test, play with your data and figure out what you want to learn!
- User actions taken within the app, what features are being used, or not being used
Quick note about licensing. With your O365 license you have access to PowerBI, in your own workspace. It will get challenging when you go to share that dashboard as you’ll need additional licenses. However there’s nothing to stop you from gaining insights on your own or taking screenshots of the dashboard and sharing it via PowerPoint or Teams.
Wrap Up
As you can see, tracking app usage and analytics is rather simple and straightforward, the hard part will be understanding what to do with the data and how to gather insights from it. However, if you’re intimate with the app, I’m confident you’ll find these insights quickly and you’ll be able to continue creating a great app for your users.