If you’re a beginner in the world of customizing SharePoint, you should get to know the developer toolbar. Even if you’re only copying and pasting code from blog posts, knowing about, and using, the developer toolbar can save you a few cycles of banging your head on the keyboard.
The developer toolbar is key. Any SharePoint developer who is doing anything on the front end (JavaScript, jQuery, CSS, HTML, etc.) heavily relies on it. It does some really awesome stuff. I am going to run through some of the key things you can get out of the developer toolbar, like:
- Element Inspection
- Scripting
- Performance
- Other Advantages
I decided to break this up into a few posts since there’s a lot of info to cover.
How do you get a Developer Toolbar?
Most if not all major browsers have a variation of one:
Internet Explorer calls it the F12 Developer Tools, and can be accessed by pressing the F12 button.
Chrome calls it Developer Tools, and can also be accessed by pressing the F12 button.
Safari calls it Web Inspector and you can get to it by pressing CTRL+ALT+i.
FireFox calls it FireBug, and is quite different than the rest, but the same functionality exists. You can get to it by pressing SHIFT+F2.
Once we have the developer toolbar running, we can explore the DOM. DOM stands for the Document Object Model, more at Wikipedia: http://en.wikipedia.org/wiki/Document_Object_Model. Basically, the DOM is your page, and all the elements you see: text, colors, shapes, images, etc.
Element Inspection
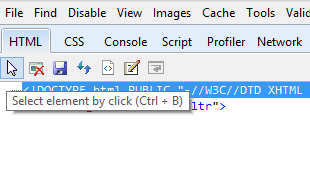
Each of the toolbars have an option to Inspect or Select an element:


With the selection tool enabled, you can then hover over elements in your page. You’ll quickly see a border wrapping the elements. Click on an item and the CSS attributes assigned to that element will appear in the toolbar.


Once you have played around with it, you can take what you know, and apply it to your custom CSS files, or in a web part. This part will require you to know CSS a little bit more, however if you mess with your CSS and decide you like a new look, you can send along your desired CSS to your developers and surprise them.
A few notes:
- Modifying the CSS is not permanent. When you refresh the page or browse to another, the CSS reverts back to what it was.
- I use IE for CSS related inspection, as it has the cleaner Trace Styles option.
- Popup dialogs and some menus are dynamically generated by a user clicking, IE doesn’t do a good job at inspecting these. I will usually use Chrome or FireFox to access these elements.
Coming up next, Scripting!
Til then, Happy SharePointing!


 RSS - Posts
FireFox has its own developer toolbar, accessible by Shift + F2. FireBug is an independently developed FireFox extension which can be added to FireFox, but does not come with FireFox.